

The freight market is improving. That part is true. 82 by February — a 20-cent jump that had carriers posting on social media for the first time in years without the word “survival” attached to it.
Tender rejection rates are creeping up. Some lanes are genuinely tightening. And compliance enforcement — the crackdown on non-domiciled CDLs with a March 16 Final Rule removing an estimated 200,000 CDL holders from the eligible driver pool — is generating the kind of supply-side optimism the industry has not felt since 2021.
But here is the problem with all of that. The thing that actually generates sustainable freight demand — not rate spikes, not capacity exits, but real, durable, repeatable freight volume — is the consumer. And the consumer, right now, is telling a completely different story than the one trucking social media is celebrating.

Understanding both stories — not just the one that feels good — is the only way to run a disciplined operation in this market. display('div-gpt-ad-1709668545404-0'); }); The Signal Everyone Is Talking About: Capacity Is Finally Leaving To understand why carriers are excited, you have to go back to the root cause of everything that has happened to trucking since mid-2022. The industry is oversupplied.
Not slightly oversupplied — catastrophically oversupplied relative to where freight demand settled after the pandemic bubble deflated. When you have too many trucks chasing too few loads, rates collapse regardless of fuel costs, regardless of driver wages, regardless of how professionally you run your business. The math doesn’t care about your operational excellence when there are ten carriers bidding on every load that would have once attracted three.
That dynamic began to shift — slowly — as carrier exits accelerated through 2024 and into 2025. Over 6,400 carrier authorities were revoked in December 2025 alone . The freight recession has been brutal precisely because it has been doing the work of forcing out the capacity that flooded in during the 2021 boom.

Now compliance enforcement is accelerating that exit. The FMCSA’s March 16 Final Rule limits non-domiciled CDLs to holders of H-2A, H-2B, and E-2 visas. FMCSA’s own estimate is that 97% of the approximately 200,000 current non-domiciled CDL holders will not qualify under the new standard.
California alone cancelled 13,000 CDLs in a single day on March 6. B. Hunt has projected total market removals of 214,000 to 437,000 drivers over the next two to three years.
That is a meaningful supply reduction in a market where supply reduction is exactly what rates need to recover. The market understands this math. That is what the spot rate optimism is about.

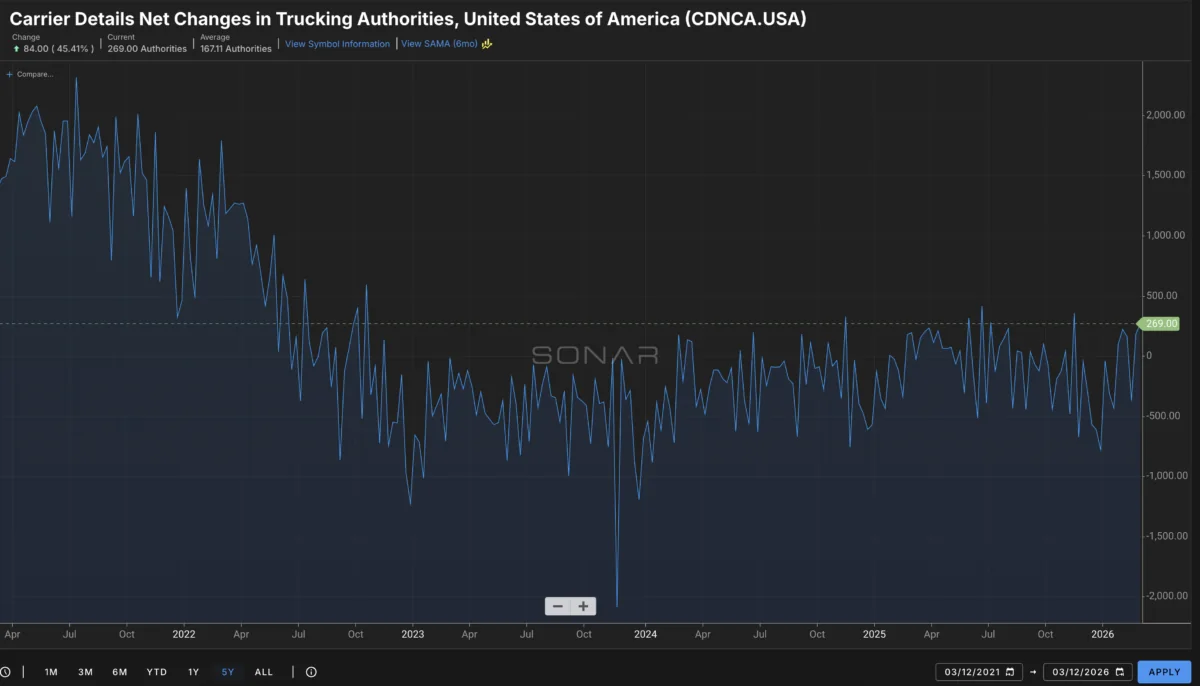
And that optimism is not irrational. But here is where the analysis has to go deeper, because supply and demand is always a two-variable equation — and the trucking industry right now is having a very serious conversation about one variable while almost entirely ignoring the other. USA.
This chart shows the difference in capacity (net) and it tells a story over the past few years of exits, as well as entrants The Signal Nobody Wants to Talk About: The Consumer Is Tapped Out Freight does not move because trucks exist. Freight moves because people buy things. That sounds obvious.
But it has a profound implication that gets lost in every conversation about CDL enforcement and capacity exits: if the people buying things run out of money, run out of credit, or simply stop buying, it does not matter how many trucks leave the market. You can remove 500,000 drivers tomorrow and rates will not recover long term if the freight they would have hauled never materializes. display('div-gpt-ad-1665767553440-0'); }); And right now, every major economic indicator tied to consumer spending is flashing yellow.
7%, the highest since Q1 2011. 7%, in the aftermath of 2008. com/1h22VTZKzQ — The Kobeissi Letter (@KobeissiLetter) February 11, 2026 Credit card debt just hit a record no one in this country has ever seen.
S. 277 trillion in the fourth quarter of 2025, according to the Federal Reserve Bank of New York — the highest balance recorded since tracking began in 1999. That number is $350 billion higher than the previous pre-pandemic record set in Q4 2019.
Balances have increased 66% since Q1 2021, when pandemic-era savings briefly pulled them down. Nearly half of all American credit cardholders — 47% — are currently carrying a balance from month to month, and the average APR on those balances is running above 20%. Americans are not saving and spending.
They are borrowing and spending, and that borrowing has a ceiling. S. consumer debt across all categories — mortgages, auto loans, credit cards, student loans — has surpassed $18 trillion.
The Federal Reserve Bank of Boston’s own research found that low-income and middle-income consumers are now carrying higher levels of real credit card debt than they held before the pandemic, while only high-income consumers still have room on their cards. The spending growth that has kept the economy appearing healthy has been concentrated at the top of the income distribution. The bottom and middle — the people who generate the bulk of everyday consumer goods freight — are stretched.
The college graduate unemployment problem is not a talent story. It is a demand story. 5% — its highest level since 2020, according to the Federal Reserve Bank of New York.
6% of those 25 and older. The unemployment rate for college graduates between ages 23–27 has risen 42% since 2019. Why does this matter to a trucker?
Because college-educated workers in their 20s and 30s are the primary demographic for household formation , new home purchases, appliance purchases, furniture purchases, and the discretionary consumer spending that generates freight. When those workers are unemployed or underemployed, they are not signing leases on new apartments. They are not buying sofas from Ashley HomeStore.
They are not ordering grills for the backyard they do not yet own. Oxford Economics has been direct about the cause: entry-level positions are being displaced by AI at measurably higher rates, and hiring for new graduates is down 16% year-over-year. This is not a temporary blip.
It is a structural shift in who is entering the consumer spending cycle — and the answer right now is fewer people than in any comparable period in over a decade. display('div-gpt-ad-1709668086344-0'); }); The housing market is confirming the same story from a different direction. S.
housing market — a 47% disparity and an all-time record in data going back to 2013. 3% that same month, the steepest monthly drop since April 2020. Foreclosure filings were up 19% year over year in October 2025.
This matters to trucking in a way that rarely gets explained clearly. Housing is the freight multiplier. Every home purchase generates a cascade of downstream freight: appliances, furniture, building materials, landscaping supplies, home improvement goods, flooring, fixtures.
New home sales and existing home sales combined represent one of the largest and most consistent freight demand drivers in the entire economy. When 600,000 more people are trying to sell homes than there are buyers to purchase them, that entire downstream freight chain goes quiet. Home Depot and Lowe’s feel it first .
Then the carriers hauling to those distribution centers feel it. Then you feel it at the load board. I believe it's no longer a question of IF but WHEN the national average price for diesel reaches $5 per gallon… thinking the next few days it'll happen.
83/gal right now. — Patrick De Haan (@GasBuddyGuy) March 12, 2026 Gas prices are now double-taxing a consumer who was already at the limit. 00 and beyond, it did not just hurt carriers on the cost side.
It hammered consumers on the spending side at the same time. Every additional dollar a family spends at the gas pump is a dollar that does not go to groceries, home goods, clothing, electronics, or any of the other categories that generate truckload freight. 27 trillion in credit card debt at 20%+ APR, a $60-a-week gas increase is not an inconvenience.
It is a budget crisis. The Equifax K-shaped economy framework describes what is actually happening right now better than any single number: the economy is splitting. High-income consumers are fine — their credit card debt is below pre-pandemic levels and their assets have appreciated.
Everyone else is navigating record debt, slowing wage growth, rising energy costs, and a job market that, for those just entering it, is the hardest in over a decade. Freight demand is generated by both halves of that economy, but the half that is struggling is the half that generates volume freight — the everyday goods movement that fills spot loads, fills retail DCs, and fills the lanes that small carriers depend on. The Class 8 Contradiction Nobody Is Asking About Here is the data point that deserves more scrutiny than it is getting.
display('div-gpt-ad-1665767778941-0'); }); Class 8 truck orders exploded in February 2026 to approximately 47,200 units — the highest order total since September 2022, rising 159% year-over-year, according to FTR Transportation Intelligence. Three consecutive months of 20%-plus year-over-year order growth. The industry is ordering equipment at a pace not seen in three and a half years.
The stated explanations are legitimate: EPA 2027 regulations are going to make new trucks significantly more expensive starting next model year, so large fleets are pulling purchases forward. Fleets that held aging equipment through the freight recession are finally cycling it out. And improved spot rate sentiment has given some carriers enough confidence to commit capital.
But read the ACT Research analysis carefully. The firm notes that the order surge is being driven by large fleets and dealers, that smaller carriers continue to face tighter credit conditions, and — most importantly — that the order turnaround reflects replacement demand and regulatory positioning more than it reflects conviction about freight volume growth. ” The concern is this: if large carriers are ordering equipment now — at the same time that compliance enforcement is removing capacity from the spot market — you could have a scenario where capacity exits through the compliance door and re-enters through the equipment order door within 12 to 18 months, before underlying consumer demand has recovered enough to absorb it.
The cycle resets. The same small carriers who held on through the freight recession find themselves competing against a refreshed large-carrier fleet in a spot market that never fully recovered on the demand side. display('div-gpt-ad-1665767872042-0'); }); That is not a prediction.
It is a risk that the data currently supports, and one that every small carrier should be thinking about. What This Means: The Sugar Rush Problem There is a concept worth naming here. When compliance enforcement removes a significant volume of capacity quickly — as the non-domiciled CDL crackdown is doing right now — it creates what looks and feels like a market recovery.
Rates improve. Load boards tighten. Sentiment lifts.
It is real. But it is a supply-side adjustment, not a demand-side recovery. And supply-side adjustments, by definition, have a ceiling determined by what demand actually supports.
Think of it like a large cookout where the food was made for 200 people and 300 showed up. As people leave — even as 100 leave — the remaining guests feel more comfortable. There appears to be enough food.
Everyone relaxes. But if nobody brings more food, eventually the supply runs out no matter how many people have left. What looks like plenty is actually just fewer people competing for the same fixed amount.
The freight equivalent: if demand does not grow to meet the tighter supply, you end up with a market that is less bad than 2024 but is not actually healthy. Rates stabilize but do not surge. Lane pricing improves in some regions but not others.
Small carriers who stretched to get through the recession find themselves still operating on thin margins, just with slightly more predictability. A genuine recovery — the kind that produces the 2021-era rate environment that so many carriers are hoping to return to — requires demand to lead. It requires consumers to spend.
It requires home sales to generate downstream freight. It requires the 22-to-35-year-old demographic to find stable employment, form households, and start buying the things that fill trucks. Right now, the data on every one of those conditions is moving in the wrong direction.
USA. Outbound Tender Volumes have road a roller coaster over the past few years and this is a good indicator of the amount of available freight to spill into the spot market. What Small Carriers Should Do With This Information None of this is an argument for pessimism.
It is an argument for precision. The supply-side improvements are real, and they will produce better market conditions for carriers who are positioned to capture them. Compliance enforcement is ongoing.
Carrier exits continue. If demand even holds flat while capacity continues to contract, rate floors will rise. There is a legitimate case for cautious optimism about the next 12 months.
But the operative word is cautious. Here is what that looks like in practice: Do not price your operation for 2021. That market was produced by a once-in-a-generation demand shock that is not coming back.
Price for the market that the consumer data actually supports right now — which is a market in gradual improvement, not explosive recovery. Carriers who set their cost structure and rate expectations to a recovery that has not yet arrived get hurt when the timeline slips. Know your break-even number cold.
25 in a matter of weeks. Every rate you accept needs to be benchmarked against that moving number in real time, not against what diesel cost last month. Do not let the sentiment change your discipline.
The danger of a market that feels like it is recovering is that it loosens financial discipline before the recovery has been confirmed by data. Watch the consumer spending numbers. Watch pending home sales.
Watch credit card delinquency rates. Those are the leading indicators for the freight volumes that will determine whether the spot rate improvement is durable or temporary. Watch the Class 8 orders.
If large fleet expansion orders — not replacement purchases — begin meaningfully increasing in Q3 or Q4 2026, that is a signal that new capacity is staging to re-enter the market. The window between compliance-driven capacity exit and equipment-order-driven capacity re-entry is the window where the best rate environment for small carriers will exist. Know where you are in that window.
Reader Submitted Questions Q: If 200,000 drivers are being removed from the market, why isn’t that enough to drive a full recovery on its own? A: Because those drivers represent supply, and recovery requires demand. Removing capacity tightens the supply side of the equation and improves rate floors — that part is real and already showing up in spot data.
But sustainable, durable rate recovery requires freight volume to grow, and freight volume is driven by consumer spending. 277 trillion in credit card debt at 20%-plus APR, housing transaction volume is at levels consistent with the 2008 financial crisis, and unemployment for the demographic most likely to generate new household spending is at its highest level in over a decade. Supply-side improvements can produce a better market than 2024.
They cannot, by themselves, produce a healthy market. That requires the demand side to cooperate. Q: The spot rate data is showing real improvement.
Why shouldn’t I take that at face value? A: You should take it at face value — as a current data point, not a trend confirmation. The rate improvement that began in late November 2025 has been real and meaningful.
But ACT Research and data have both noted that the rate run-up has been at least partially weather-influenced and compliance-driven, not purely demand-driven. A demand-driven rate spike — the kind you see when consumer spending is expanding and shippers cannot get enough trucks — looks different from a supply-tightening rate spike. The former is self-reinforcing.
The latter requires continuous capacity exit to sustain. Track whether the rate improvement holds through spring when seasonal demand normalizes. If it does, you have evidence of genuine demand improvement.
If it fades, you have confirmation of what the consumer data is already suggesting. Q: What is the one number you would watch most closely to confirm whether a real recovery is coming? A: Consumer credit card delinquency rates.
Not because delinquency itself generates freight, but because it is the most direct real-time signal of whether the consumer is managing or breaking. 57% through 2026, which is elevated but stabilizing. If that number starts rising meaningfully, it means consumers are losing their ability to spend on credit, which is the mechanism that has been sustaining consumer spending even as wages and savings have not kept pace.
A delinquency spike would be the signal that the consumer engine is not just under pressure — it is stalling. And when the consumer engine stalls, freight demand follows within one to two quarters. The freight market right now is like a patient who has been sick for three years, just started a new treatment, and is showing early signs of improvement.
The improvement is real. The early data is encouraging. But the underlying conditions that made the patient sick have not fully resolved, and declaring a full recovery before the vitals confirm it is how you end up back in the hospital.
Stay disciplined. Watch the data behind the headlines. And operate your business for the market that exists today with the hope that a true recovery of spending is on the horizon.


