
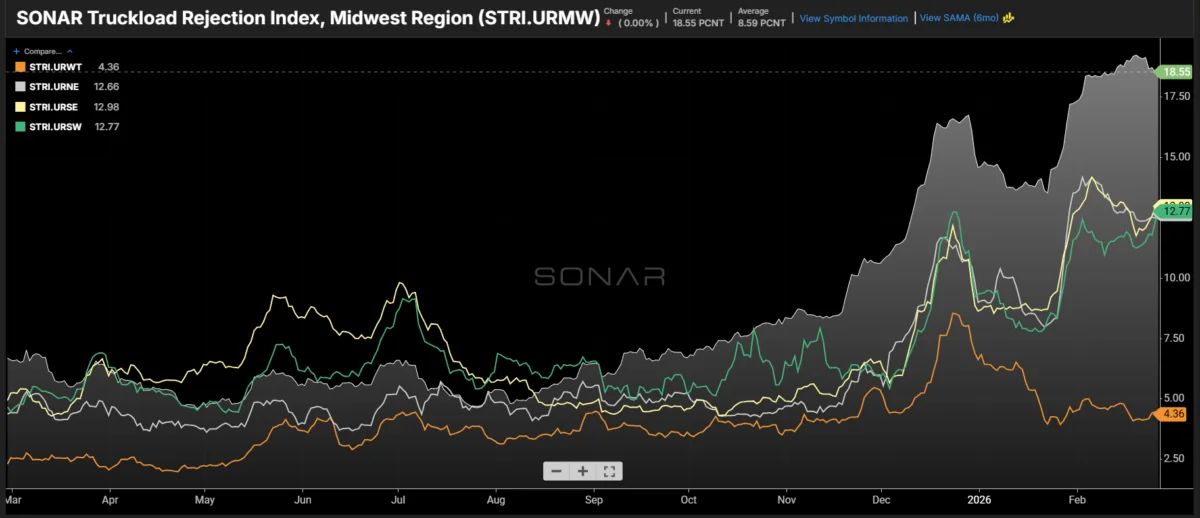
URWT Amid a nationwide shift in the trucking market from an oversupplied capacity environment to a much more challenging one, the Midwest has been the most disrupted region over the past six months. Tender rejection rates in the nation’s largest region by volume have averaged 4 to 5 percentage points higher than the next-highest region for several months. Meanwhile, the West Coast is experiencing the lowest rejection levels in the country — potentially part of the same underlying mechanism.
Although much of the recent truckload market volatility has been attributed to weather, which has an outsized influence on the Midwest in the winter, there was no major weather event in September when rejection rates first began to diverge. Concentration of reefer One contributing factor to the Midwest’s relative tightness may be the strength of the refrigerated segment in that region. Roughly 30% to 35% of all outbound refrigerated tenders originate in the Midwest.
While the dry van market was relatively flat from September through late October, the refrigerated market tightened at a steady pace. 5% to more than 13%. Intermodal’s pull Another potential driver of regional imbalances is the growing use of intermodal over the past few years.

Longer order lead times — influenced by geopolitical and trade uncertainty — have given shippers more flexibility to move freight across the country. Intermodal offers lower costs and environmental advantages, albeit with slightly longer transit times. S.
— have increased more than 40% since February 2024. Over the same period, truckload tender volumes for freight moving more than 800 miles out of Los Angeles have declined 21%. This suggests a modal shift that has eroded truckload demand on the West Coast.
As more long-haul freight shifts to rail from coastal origins, a greater share of truckload activity originates in the Midwest. S. A coming wave?

The western region also tends to soften early in the year due to lower import volumes, introducing a seasonal component to its weakness. Rejection rates typically rebound in April — or, as seen last year, in June after tariffs on China were eased. It is clear that the national market is beginning to tighten, but the uneven nature of the shift may be a warning sign.
Once import flows resume, it could add another layer of pressure to the truckload market. During the pandemic, the Los Angeles market was the epicenter of disruption. While few expect a return to that level of volatility, it remains an important factor to monitor in the months ahead.
SONAR aggregates data from hundreds of sources, presenting the data in charts and maps and providing commentary on what freight market experts want to know about the industry in real time.


