

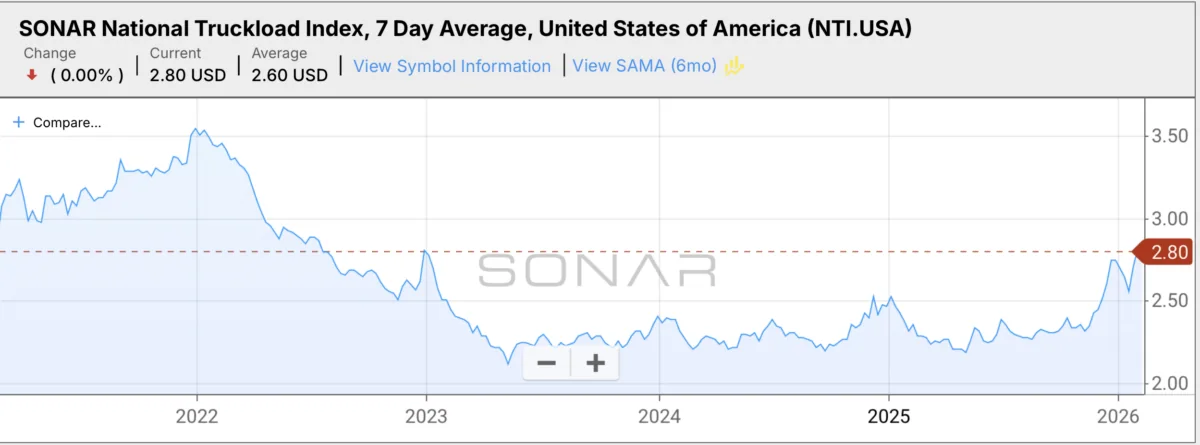
The trucking industry has been on a downward trajectory for most of the past three years, with rates falling and tender rejections increasing. However, recent data suggests that this trend may be reversing. The SONAR National Truckload Index (NTI) has reached $2.80, its highest point in ages, indicating stability with upward pressure building. This is a crucial indicator that rates are no longer scraping along the bottom but have started to show signs of improvement.
The decline in truckload volumes has been a significant factor in the industry's struggles. However, recent data shows that freight demand is not collapsing as sharply as it was in 2023. The Outbound Tender Volume Index (OTVI) measures how much freight shippers are trying to move electronically through contract tenders, and its current reading of around 10,110 is slightly below its historical average of 11,731. This stabilization of volumes is a positive sign for the industry.
The decline in tender rejections has also been a key factor in the recent rate downturn. However, with OTRI now sitting at 13.40%, well above its recent averages, carriers are starting to gain options and declining lower-paying contract freight in favor of better opportunities in the spot market. This is driving up spot rates and building momentum.

The industry has been experiencing a net contraction in active authorities, with more carriers leaving than entering. However, this trend is changing, and the number of new entrants into the market is starting to slow down. When capacity shrinks while freight stabilizes, the market tightens, leading to higher prices. This gradual tightening of market conditions is a positive sign for rates.
The TRAC map shows lane-level rate momentum, with most lanes currently showing above-average rate increases. While this does not mean every lane is hot, it indicates that more outbound lanes are showing rate strength than weakness in comparison to a few days ago. This signals broader tightening of market conditions and the potential for higher rates.
While markets don't always follow a predictable pattern, historically, breakouts have occurred when three key indicators align: volumes stabilize, tender rejections increase, and capacity shrinks. With all three happening simultaneously, it suggests that the long bottoming process may be ending and a breakout could be on the horizon.

The carriers who survived the downturn have leaner operations and lower overall costs in some cases. If rates lift meaningfully, those operators will see margin relief quickly. However, for those who were barely holding on operationally, even in a rising market, struggles are still likely.
It's essential to note that markets don't always follow a predictable pattern, and there is always the risk of a head fake or a sudden downturn. However, the data is no longer pointing downward; it's pointing sideways to slightly up. This change in trend is significant and warrants attention from industry participants.
For now, it's essential to stay plugged in and cautious but not ignore what the data is saying. Something is shifting in the market, and this could be the early stage of a breakout. The next 60-120 days will tell us whether this is a head fake or the beginning of a more significant trend.

The recent uptick in rates and stabilization of freight demand indicate a potential market shift.


